
Industrial control systems are vital infrastructures that need strict security protocols, particularly those that operate in operational technology (OT) environments. Using USB devices in these settings raises certain red flags as they may bring malware or unapproved access.
Background
Organizations can use event tracing to implement USB monitoring as a solution to this problem. In this article, we will cover the relevance of monitoring USB usages in OT contexts, the benefits of event tracing, and a step-by-step tutorial on setting up an event tracing system.
The operating system has a general-purpose, high-speed tracing feature called Event Tracing for Windows (ETW). In order to offer a tracing method for events that are triggered by both user-mode programmes and kernel-mode device drivers, it makes use of a buffering and logging system that is implemented in the kernel. Furthermore, ETW offers the flexibility to dynamically enable and stop logging, making it simple to conduct thorough tracing in production systems without the need for reboots or application restarts. An asynchronous writer thread writes per-processor buffers to disc as part of the logging system. Large-scale server applications may write events with the least amount of disruption because to this buffering.
The Significance of Monitoring USB Usages in OT Environments
USB devices are frequently used in OT environments for a variety of tasks, including data transfer, configuration modifications, and software updates. On the other hand, this brings with it security risks like malware introduction, data exfiltration, and illegal access to vital systems. It’s critical to keep an eye on USB usage in OT situations for the following reasons:
Threat Detection:
By monitoring USB events, managers can notice suspicious actions, such as unauthorized USB device insertion or attempts to access critical information.
Compliance and Audit:
Monitoring USB activity assists in meeting the compliance criteria that are mandated by several industrial sectors. For future reference, it offers an audit record of all actions pertaining to USB.
Incident Response:
Examining USB-related event logs can help with forensics and incident response in the case of a security breach. This can help determine the scope and cause of the attack.
Setting up USB Event tracing:
Here’s a step-by-step guide to setting up USB event tracing in OT environments:
- Ascertain which OT environment systems need to be monitored via USB. Workstations, servers, and crucial industrial control systems may be among them.
- Choose an event tracing programme that is compatible with USB event monitoring. There is “Windows Event Tracing” (ETW) in Microsoft Windows, and there are “ftrace” and “SystemTap” options in Linux.
- To enable USB event logging, configure the event tracing instrument of your choice. Use the “Microsoft-Windows-USB-USBHub” provider in Windows. Use “ftrace” or “SystemTap” on Linux to enable USB event tracing, depending on the tool you’ve selected.
- Configure event filters to record certain USB events of interest, such the insertion of a device, the transfer of files, or any unusual behavior.
- For storage and analysis, forward the gathered event logs to a centralized log management system. This makes sure that all events connected to USB are combined for simpler tracking and searching.
- Set up real-time notifications to alert managers about questionable USB activity based on pre-established patterns or guidelines.
USB Event IDs in Windows
Recognizing Microsoft Event IDs is one of the prerequisites for determining the insertion status of a USB device. This makes a search for qualifying events more focused by excluding events that aren’t relevant from the collection.
The values of the event ID’s are:
1000: Startup of the driver manager service. The Driver Manager service started successfully
1003: Creation of a new driver host process. The Driver Manager service is starting a host process for device (Device){GUID}.
1004: Creation of a new driver host process. The host process ({GUID}) started successfully.
1006: Shutdown of a driver host process. The host process ({GUID}) is being asked to shutdown.
1008: Shutdown of a driver host process. The host process ({GUID}) has been shutdown.
2000: Startup of a new driver host process. The UMDF Host Process ({GUID}) is starting up.
2001: Startup of a new driver host process. The UMDF Host Process ({GUID}) started successfully.
2003: Loading drivers to control a newly discovered device. The UMDF Host Process ({GUID}) has been asked to load drivers for device (Device).
2004: Loading drivers to control a newly discovered device. The UMDF Host is loading driver WUDFUsbccidDriver at level 0 for device (Device).
2005: Loading drivers to control a newly discovered device. The UMDF Host Process ({GUID}) has loaded module C:\windows\System32\USER32.dll while loading drivers for device (Device).
2006: Loading drivers to control a newly discovered device. The UMDF Host successfully loaded the driver at level 0.
2010: Loading drivers to control a newly discovered device. The UMDF Host Process ({GUID}) has successfully loaded drivers for device (Device).
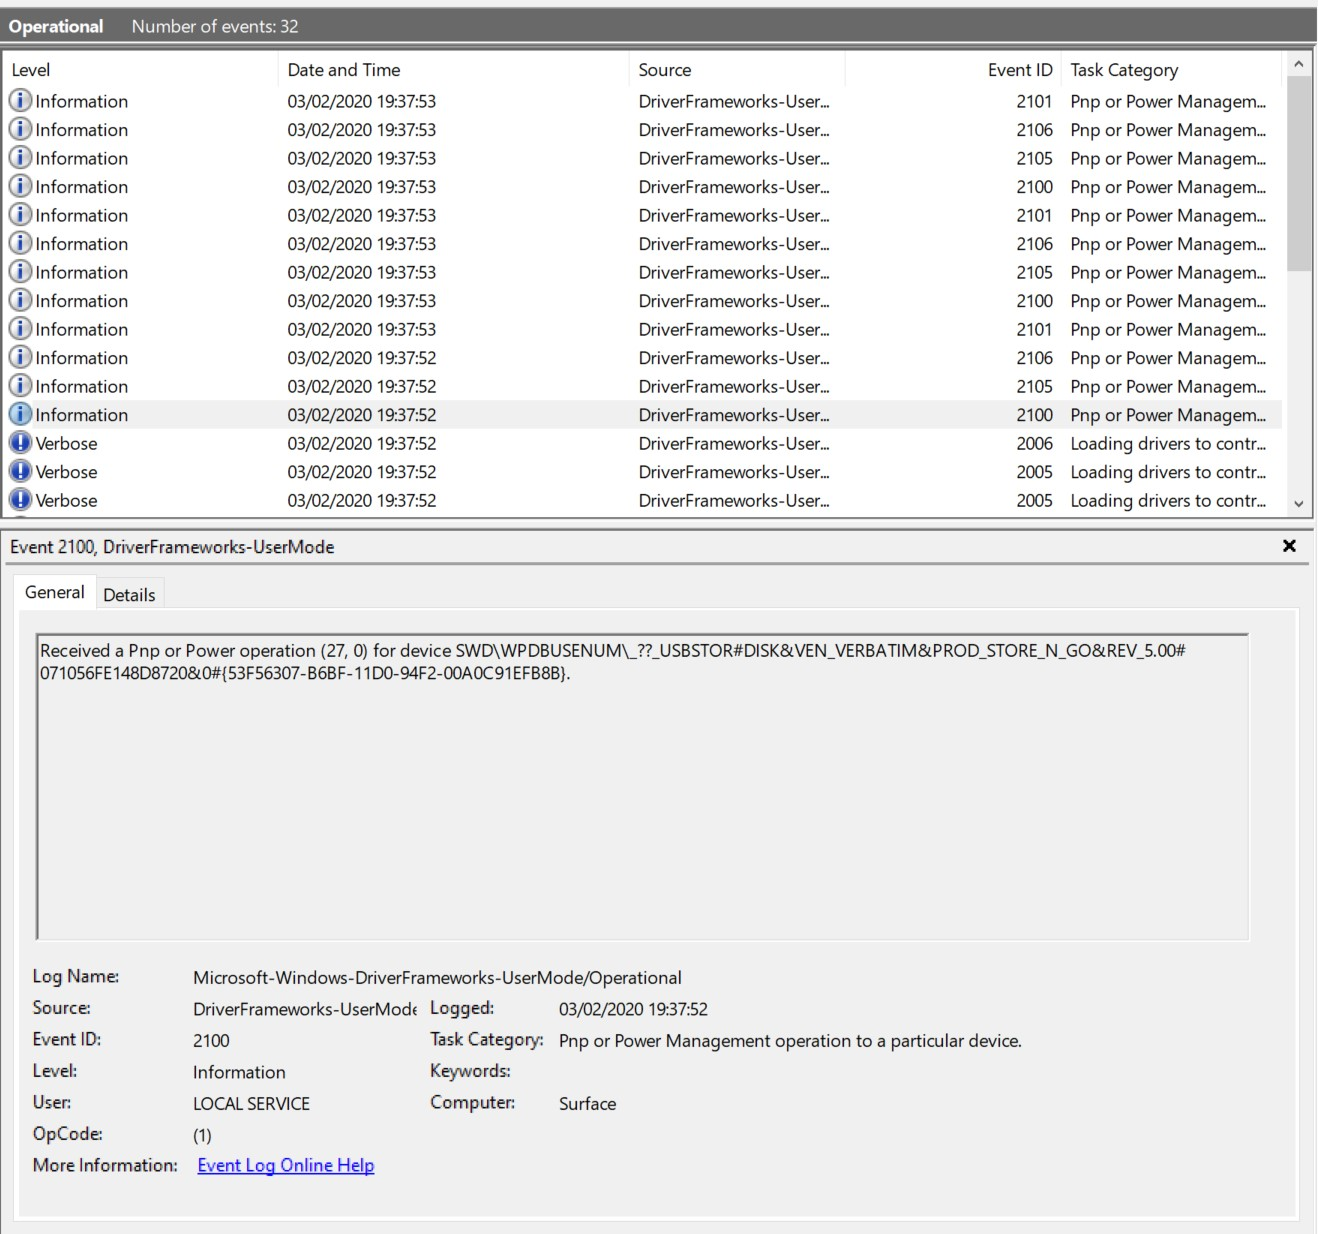
2100: Pnp or Power Management operation to a particular device. Received a Pnp or Power operation (RequestMajorCode, RequestMinorCode) for device (Device).
2101: Pnp or Power Management operation to a particular device. Completed a Pnp or Power operation (RequestMajorCode, RequestMinorCode) for device (Device) with status 0x0.
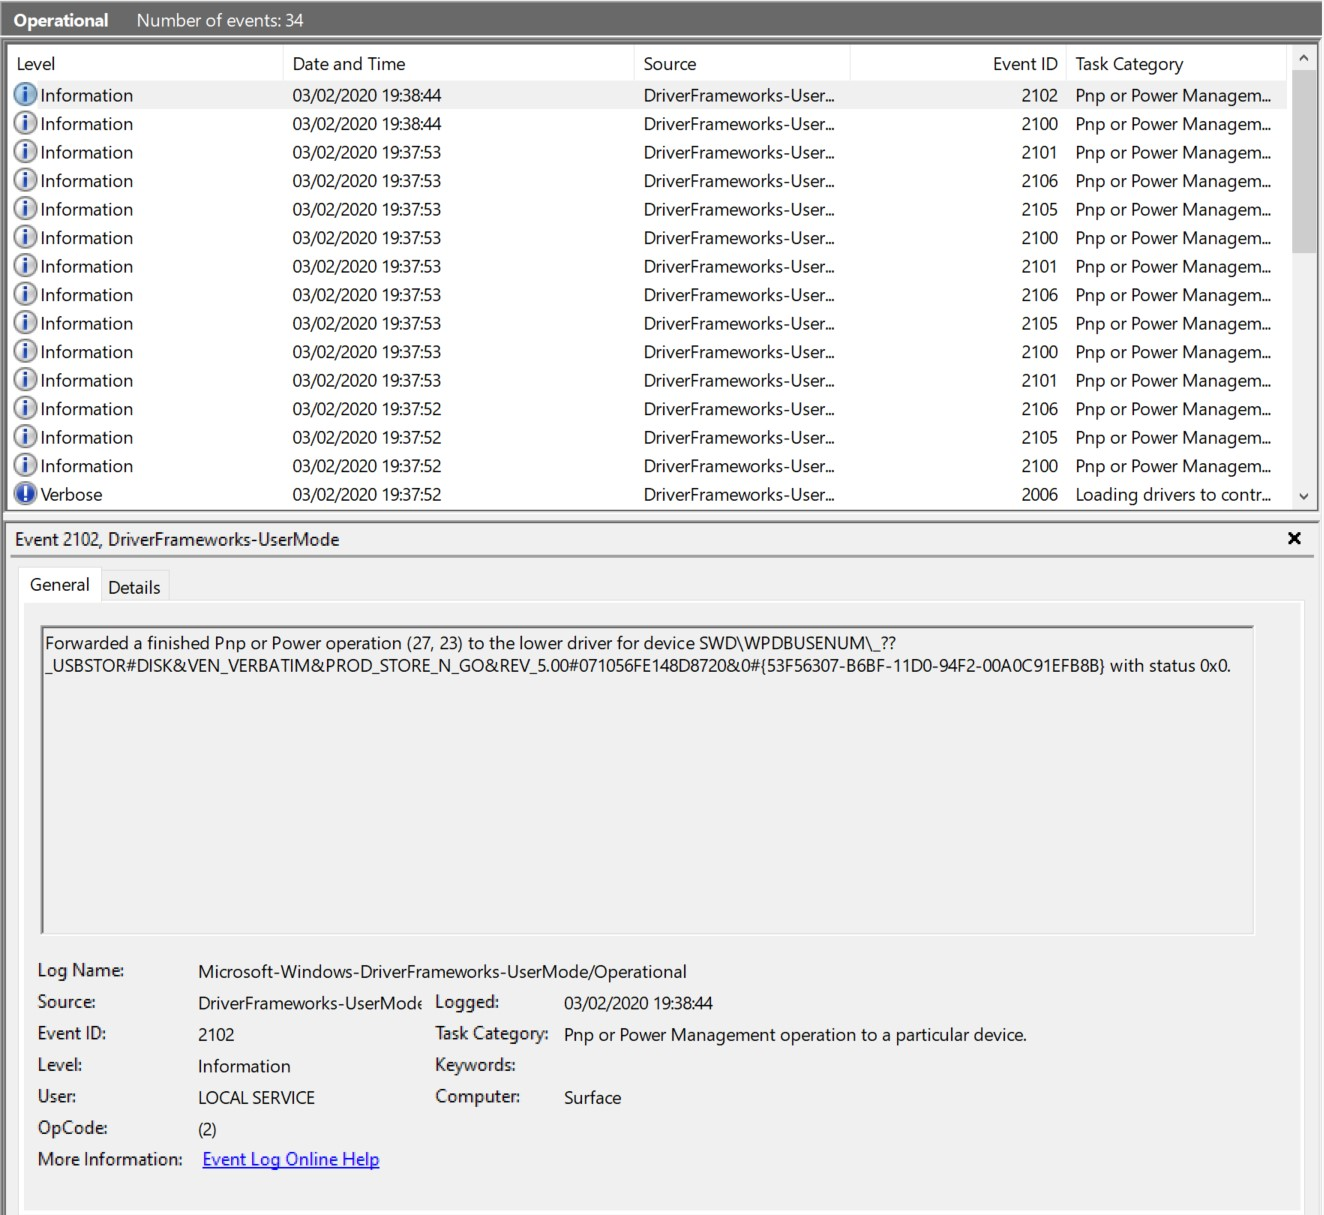
2102: Pnp or Power Management operation to a particular device. Forwarded a finished Pnp or Power operation (RequestMajorCode, RequestMinorCode) to the lower driver for device (Device) with status 0x0.
2105: Pnp or Power Management operation to a particular device. Forwarded a Pnp or Power operation (RequestMajorCode, RequestMinorCode) for device (Device) to the lower driver with status 0xC00000BB
2106: Pnp or Power Management operation to a particular device. Received a Pnp or Power operation (RequestMajorCode, RequestMinorCode) for device (Device) which was completed by the lower drivers with status 0x0
2900: Shutdown of a driver host process. The UMDF Host ({GUID}) has been asked to shutdown.
2901: Shutdown of a driver host process. The UMDF Host ({GUID}) has shutdown.
After analyzing the events, we came to the conclusion that, without being unduly verbose, Event IDs 1003, 2003, and 2102 offered the optimal set of events to indicate the insertion and removal of a device.
Using the Windows Event Logs to Track USBs
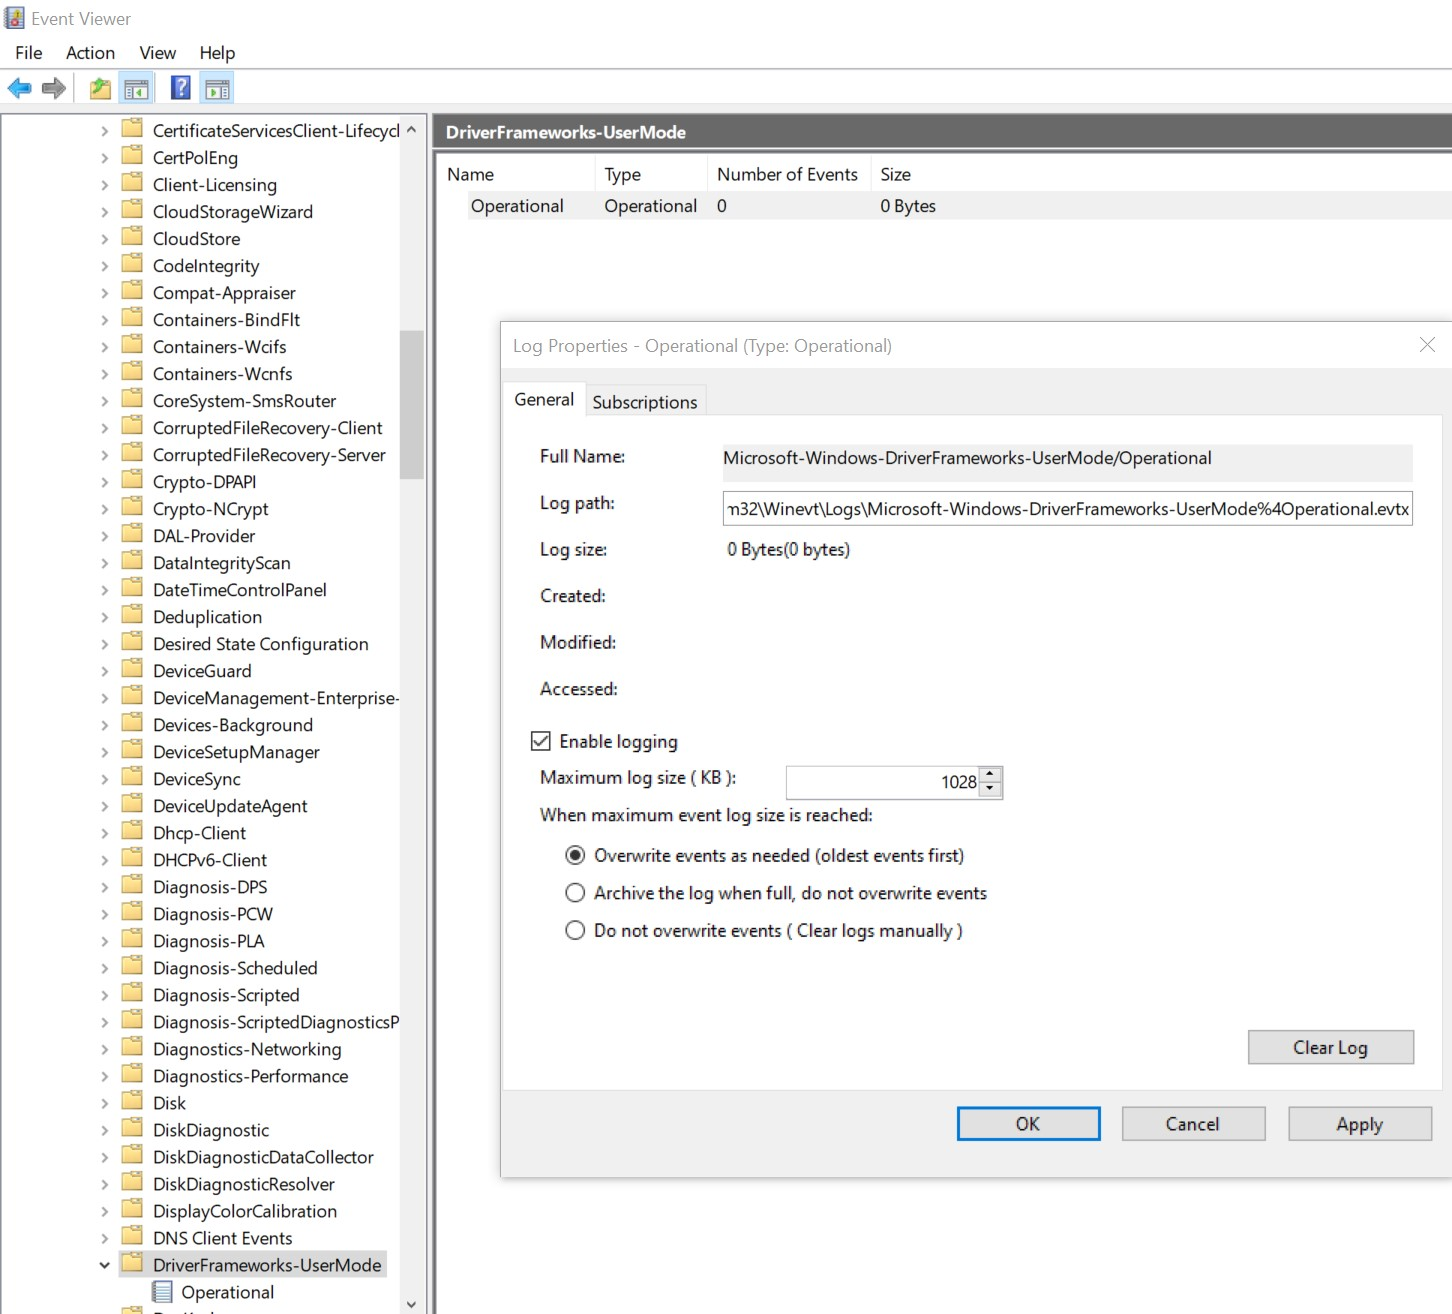
The windows event logs file is located at:
%systemroot%\System32\Winevt\Logs\Microsoft-Windows-DriverFrameworks-UserMode%4Operational.evtx
And can be accessible from Eventviewer:
Application and Services Logs > Microsoft > Windows > DriverFrameworks-UserMode > Operational
However, this particular log is not enabled by default and can be Enabled in Event viewer as shown in the figure below.
Example: Connecting and disconnecting a typical USB flash drive
The following event ids can be used when connecting a USB flash drive
2100
2003
2004
2006
The following event ids can be used when disconnecting a USB flash drive
2100
2102
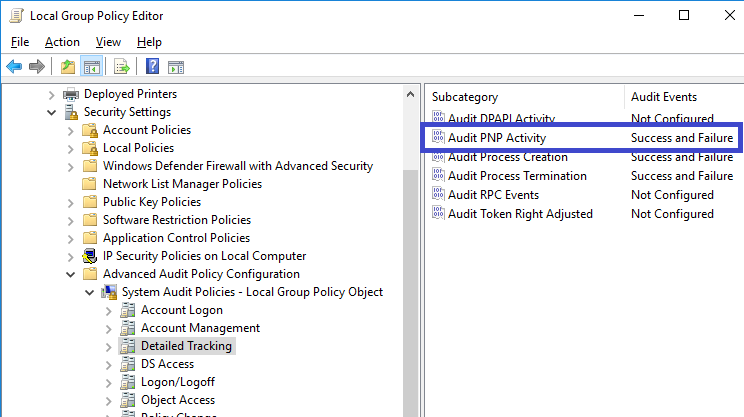
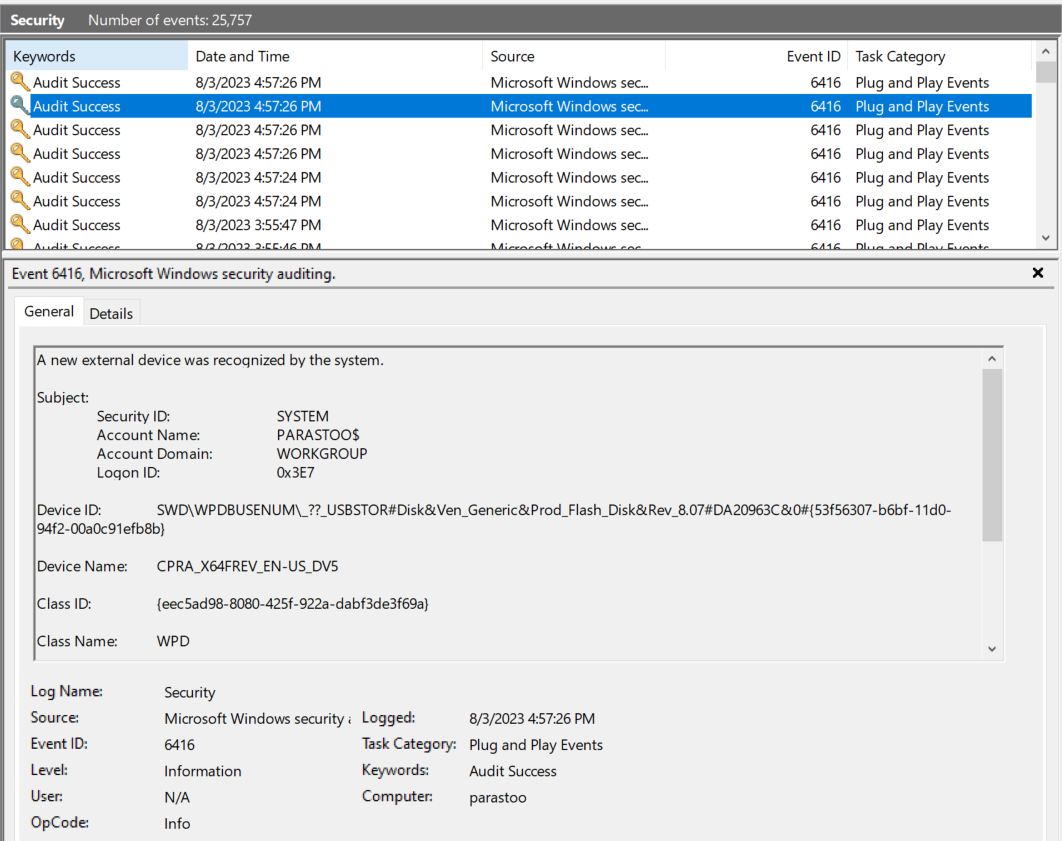
Windows Security Log Event ID 6416
Auditing USB Logs by “Audit PNP Activity” is not enabled for this item by default. When the audit setting “Audit PNP Activity” is enabled on Windows 10, event ID 6416 is recorded and 6416 shows a new external device was recognized by the system.
6416: A new external device was recognized by the system.
6416 – New USB Device
6419 – Device is disabled
6420 – Device is disabled
6421 – Enabling device
6422 – Enabling device
Implementing Event Tracing in Linux-based OT Environments
In Linux-based OT environments, event tracing can be effectively implemented using two powerful tools – “ftrace” and “SystemTap”.
1. ftrace: Internal Tracing Framework
“ftrace” is an internal tracing framework built into the Linux kernel, allowing users to trace various kernel functions and events, including USB-related activities. It offers a lightweight and efficient tracing solution that can be tailored to capture specific USB events of interest, providing valuable insights into the system’s behavior.
2. SystemTap: Flexible Tracing Mechanism
“SystemTap” provides a more flexible and versatile tracing mechanism, enabling users to write custom scripts that monitor USB events and capture specific information. With “SystemTap,” administrators can create complex event filters, perform dynamic tracing, and gather detailed data about USB activities. This extensibility makes it a powerful tool for deep-dive USB monitoring in complex OT environments.
By using these tracing tools in Linux-based OT systems, easily keep track of USB usage, detect any potential security risks, and respond quickly to any incidents. Combining event tracing methods from both Windows and Linux, you can create a strong USB monitoring system to protect critical systems and maintain high security standards.